Optimizing 3’ UTR Sequences and Secondary Structures To Improve mRNA Vaccine Thermostability
September 2023, Existential Risk Lab SRF
Abstract
This paper works toward the development of a highly thermostable mRNA vaccine by fulfilling an unmet need for the stability optimization of non-coding regions. In particular, 3' Untranslated Regions (UTRs), which have been documented within the literature to have significance over mRNA stability and temperature sensitivity. Leveraging a UTR database and a model to predict stability via Mean Free Energy Change, this research identifies 3' UTR sequences with optimally stable secondary structures that outperform industry benchmarks. Through the use of unsupervised learning techniques, it was found that sequence length and “G” and “C” nucleotide frequencies significantly impact Minimum Free Energy (MFE), uncovering their undiscussed relevance in choosing and designing effective 3’ UTRs. While this paper examines a specific mechanism of mRNA stability, it underscores the broader need for 3' UTR optimization for its contributions to translation efficiency and molecular stability. This paper aims to spark more interest in mRNA vaccine stability outside of conventional focus areas like coding regions to work towards a larger goal of increasing pandemic preparedness.
Introduction
The primary agent of pandemic response over the course of COVID-19 was the mRNA vaccine. With the backing of government and NGO schemes like COVAX and Operation Warp Speed, these countermeasures were able to be developed and distributed within a year — a timeframe unforeseen in past pandemics. Pharmaceutical companies like Pfizer and Moderna were able to reach over 90% vaccine efficacy (Katella, 2023), and countries like the UAE, Brunei, Malta, and Chile were able to immunize almost their entire populations (Yarlagadda et al., 2022). On virtually all fronts, the rapid production of mRNA vaccine platforms and their logistics was an achievement in the larger effort of widespread pandemic preparedness.
However, this strategy was not without its flaws. Countries like Burundi and Congo failed to acquire an equitable amount of doses to vaccinate their population, with penetration rates as low as 0.1% and 0.2% respectively (Yarlagadda et al., 2022). A key reason for this was the cold-chain equipment and refrigeration needed to store FDA-approved mRNA vaccines to maintain their efficacy. For example, the Pfizer-BioNTech vaccination required refrigeration temperatures of -60 to -80 °C. For nations lacking the adequate infrastructure or budget to meet these logistic demands, the acquisition and management of these biologics proved difficult. The inability to meet these requirements often leads to vaccine wastage, a public health concern beyond COVID-19 that has been well documented in the literature (Fahrni et al., 2022).
Therefore, there has been an advocated need for the development of a clinically effective thermostable mRNA vaccine that does not prescribe ultracold storage requirements (Uddin & Roni, 2021) (Foged, 2022). This would reduce the cost of transport and storage mechanisms in the removed need for equipment like cold-chain boxes, and in doing so alleviate the financial burden of vaccines on countries (particularly low- and middle- income ones) and allow for increased vaccine penetration worldwide. This would be highly beneficial for global pandemic preparedness as the development of pipelines and vaccine platforms that allows for increased vaccine procurement would help populations reach herd immunity faster. The difficulty lies in maintaining clinical efficacy while also optimizing for less temperature sensitivity, so that they are able to be both effective and accessible in inducing durable immunity.
Several approaches have attempted to tackle this temperature barrier, from improving the methods with which vaccines are dried, optimizing the structures of carrier molecules (ex. lipid nanoparticles) used for mRNA molecules, to experimenting with double-stranded RNA (Uddin & Roni, 2021). One attempt by Zhang, H., Zhang, L., Lin, A. et al. borrowed techniques from natural language processing to optimize the coding regions of mRNA sequences that translated to the SaRS-Cov-2 spike protein. With their algorithm called “LinearDesign”, the researchers were able to rationally design mRNA sequences that were optimized for both codon optimality and stability. When tested in vivo, they found that their formulations outperformed industry standards in half-life (to measure resistance to degradation/temperature sensitivity) and induced immunity (Zhang et al., 2023).
While this paper produced interesting and significant results and discusses its implications for the rational design of more thermostable vaccines, the authors noted that non-coding mRNA regions were designated as out of scope for the project. When reviewing the literature, it was found that there has not yet been a comprehensive approach to optimizing the stability (as opposed to optimizing the support of translation/gene expression) of the non-coding regions of mRNA strands, despite the fact that they contribute to the overall temperature sensitivity of these vaccines. In particular, 3’ Untranslated Regions (UTRs), are known to form secondary structures that vary in stability and therefore impact the stability and intracellular kinetics of the mRNA molecule as a whole (Fang et al., 2022) (Von Niessen et al., 2019). In fact, the article discussed above describes the importance of UTRs and the potential for them to be optimized as well in future research: “… the robustness of LinearDesign in optimizing coding region independent of UTR pairs. In fact, these two directions (coding region design and UTR engineering (Fahrni et al., 2022)) are complementary and can be combined in future work”.
The research conducted within this paper aims to fulfill this unmet need in the effort towards principled and effective mRNA vaccine design. With the use of a publicly available UTR database and the methods utilized by the LinearDesign algorithm to predict RNA stability (”mean free energy change”), the identification and analysis of optimally stable 3’ UTR sequences and their secondary structures will be discussed. Then, the results of principal component analysis (PCA) to identify sequence and structural motifs that correlated with optimal stability will be discussed, followed by a comparison of the stability of the 3’ UTR sequences found here and the benchmark sequences used by pharmaceutical companies. In doing so, this paper hopes to spark more interest in considering non-coding regions and the ways in which their sequence design can be conducive to the formulation of effective and thermostable mRNA vaccines to be used in future pandemics.
Background
In an mRNA vaccine, the mRNA itself is composed of several structural elements: an open reading frame (ORF), 5’-UTR, 3’-UTR, 5’ cap, and poly(A) tail. The 5’ cap and poly(A) tail are added to improve intracellular stability. The ORF contains the RNA sequence that actually undergoes translation. Flanking the ORF are the UTRs (note: “untranslated” regions), which are RNA sequences that are used to increase the molecule’s half-life and levels of protein expression (Kim et al., 2021). Both 5’- and 3’ UTRs are important for the modulation of nucleo-cytoplasmic mRNA transport, subcellular localization, and message stability (Lo Giudice et al., 2022).
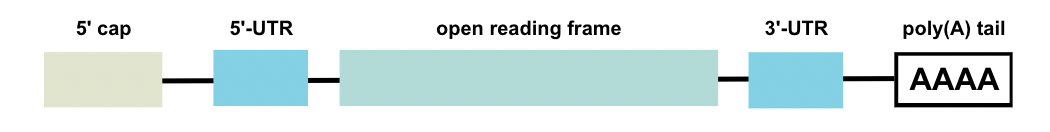
Figure 1. The structure of an mRNA
5’- and 3’- UTRs contain regulatory sequence elements with significant implications for mRNA stability, ribosome recognition, mRNA secondary structures, and the interaction of the molecule with translation machinery components (Kim et al., 2021). Additionally, UTRs can influence the rate of mRNA degradation (and translation efficiency) by interacting with RNA-binding proteins. 3’-UTRs are known to be particularly important to mRNA stability (Fang et al., 2022).
UTRs also contribute to overall stability in that their sequences form secondary structures.
A secondary structure is the three-dimensional spatial arrangement of the UTR strand that arises from hydrogen bonding between complementary nucleotide bases within the sequence. The thermodynamic stability of an RNA secondary structure (in this case the structure of the UTR) can be quantified with the concept of minimum free energy (MFE). This term refers to the lowest amount of energy needed for the RNA molecule to maintain its secondary structure; it represents the amount of energy needed to break and form hydrogen bonds between base pairs and other interactions within the structure. The MFE value is associated with the most stable conformation that the RNA molecule can adopt under a set of conditions – the lower the MFE, the more stable the RNA molecule (Zuker, 1989).
Zhang, H., Zhang, L., Lin, A. et al. demonstrated the validity of this metric when predicting the stability of mRNA coding regions. Degradation rates in solution were found to positively correlate well with MFE values; mRNAs with high MFE degraded faster, supporting the idea that RNA structures with lower MFE are more resistant to in-solution degradation and thus more stable (Zhang et al., 2023).
In this way, another mechanism by which UTRs contribute to mRNA stability is through “cumulative stability”. The secondary structure of the entire mRNA molecule is comprised of the UTRs’s structures and the ORF’s structure. The MFE of each UTR’s secondary structure is factored into the mRNA’s overall MFE, so UTRs optimized for stability (low MFE) could improve the mRNA’s overall stability (overall lower MFE).
Several approaches to UTR design with the goal of supporting mRNA protein expression have come out in recent years (Zeng et al., 2020) (Von Niessen et al., 2019) . However, research dedicated to optimizing UTRs for stability could not be found within the currently available literature. While the UTRs used by vaccine manufacturers are publicly known (Fang et al., 2022), little has been described or published regarding efforts toward optimizing their sequence and structure to more thermostable mRNA vaccines.
Methods
The first step in this paper’s methodology was to create a subset of UTR sequences from a publicly available dataset of eukaryotic 5’- and 3’- UTRs. Only 3’-UTRs and those from Homo sapiens genes were used because the size of the entire dataset was computationally unfeasible at over 26 million logged UTR sequences (Lo Giudice et al., 2022). This subset was chosen in accordance with (Katella, 2023) 3’-UTRs having the most basis in the literature about being linked to mRNA stability as discussed in “Background”, (Yarlagadda et al., 2022) the industry standard that all vaccine manufacturers use UTRs that are present in the Homo sapien genome. However, avenues for exploring UTRs outside of this paper’s scope could produce interesting results and are discussed in Conclusions.
After applying this filter, 2 million sequences remained. 218 of these sequences were randomly selected to be used because of the limited computing power available at the time of writing, however, I have plans to run the code at a significantly larger batch size on the supercomputer available at my institution.
With these UTRs, the optimal secondary structures were predicted in dot-bracket notation and their associated MFE values were calculated with ViennaRNA’s RNAFold Python package. The UTRs from the database are originally written in the format of DNA bases that correspond to the sequence pre-transcription: RNAFold converts the sequence into RNA bases and then predicts the strand’s optimal structure. The UTRs then underwent global minimization to identify the five entries with the lowest MFE values: the candidates with the highest modelled thermostability. Their MFE values were compared to those of the 3’-UTRs used by vaccine manufacturers to gauge whether my UTR candidates were predicted to be more stable than the industry standards.
The secondary structures of the most stable UTRs were then visualized with the use of forgi’s python library in two ways: (a) as a complete structure, with all structural elements and nucleotides visible, and (b) as a graph of nodes and edges, simplifying the visualization to just the locations of primary structural elements. An example of this is shown in Figure 2.
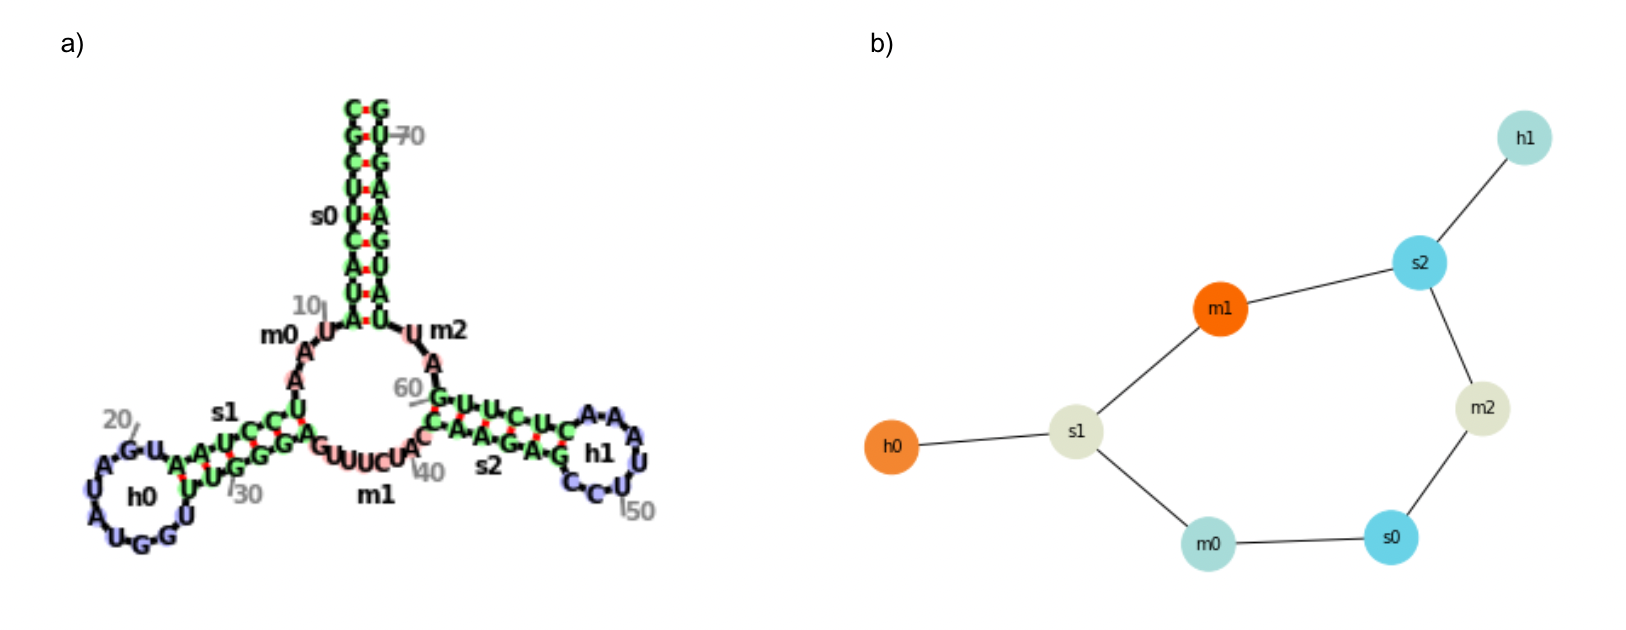
Figure 2. Sample Visualization for a Random Sequence
- A complete secondary structure visualization, showing nucleotides and annotated structural elements.
- A simplified secondary structure visualization in graph format, with nodes representing structural elements and edges representing where they are connected.
The letters representing each kind of structural element are: f (fiveprime, the unpaired nucleotides at the 5’ end of a molecule), t (threeprime, the unpaired nucleotides at the 3’ of a molecule), s (regions of contiguous canonical base-paired nucleotides), i (bulged out nucleotides and interior loops), m (single-stranded regions between two stems), and h (hairpin loop) ("RNA Secondary Structure as a Graph," n.d.).
After predicting the secondary structures of all UTRs in the dataset, the structures were analyzed for variables like sequence length and numerical features were extracted as these were used for clustering analysis. The total set of features found for each UTR included: the frequency of each kind of structural element (f/s/m/i/h/t), the frequency of each combination of graph edge between two structural elements (ex. f-m), the number of nucleotides contained within each kind of structural element, the sequence length, and the frequency of each kind of nucleotide within the sequence.
This allowed the structures to be described numerically within a tabular format, to then undergo principal component analysis (PCA) and t-distributed Stochastic Neighbor Embedding (t-SNE). PCA was used to initially cluster the dataset based on similar MFE values, and then t-SNE was used to tighten and optimize the clusters. PCA was also performed in isolation for the purpose of component loading, which is used to understand which features are the most significant in determining how the data points are clustered. In doing so, I was able to understand which components of a UTR’s sequence and structure have the most impact on its MFE.
UTRdb 2.0: Library of 5’- and 3’- UTR Sequences
UTRdb 2.0 is the second iteration of a comprehensive and publicly available library of eukaryotic 5’- and 3’- UTR sequences. It contains over 26 million entries from 573 species, and the UTRs come with functional annotations of information like evolutionally conserved blocks and m6A modifications. Each UTR is tagged with its type (5’ or 3’), its biological origin, and its sequence is reported in the format of DNA bases (Lo Giudice et al., 2022).
ViennaRNA and RNAFold: Predicting Optimal Secondary Structures and MFE
ViennaRNA is a commonly used software package for predicting and analyzing RNA secondary structures. Its Python package, featuring the “RNAFold” tool, takes input sequences and finds their optimal secondary structures alongside the MFE value (ViennaRNA, 2023).
Forgi: Visualizing and Describing Secondary Structures
RNAFold outputs secondary structures in the form of dot-bracket notation: a series of periods and parentheses that are unintelligible to those unfamiliar with the format. Forgi is a Python package that was used to overcome this, with the capability to read RNA secondary structures in dot-bracket notation and output them graphically ("RNA Secondary Structure as a Graph," n.d.).
Principal Component Analysis (PCA) And t-distributed Stochastic Neighbor Embedding (t-SNE): Identifying Structural Elements Correlated With MFE
PCA and t-SNE are two methods are dimensionality reduction and data visualization that allow you to graphically separate a dataset into clusters. The former is a linear technique and seeks to identify underlying principal components within a dataset by projecting the data onto lower dimensions, minimizing variance, and preserving large pairwise distances. t-SNE was used following PCA, and it operates differently in that it is a non-linear technique. This means it is able to separate data points with more complex partitioning than a straight line. PCA is known to preserve the variance in a dataset, whereas t-SNE is known to preserve the relationships present between data points in a lower-dimensional space. Both were used in Python with scikit, numpy, and plotly express (Awan, 2023).
Results and Data Analysis
Identification and Performance of Most Stable UTR Sequences
After running RNAFold on my batch of 3’ UTR sequences and identifying the five with the lowest MFE values, the same MFE prediction algorithm was run on sequences used by Pfizer/BioNTech, LIVERNA, Moderna, Stemirna, and Ribobio. After comparing my candidate UTRs and those used in industry, I found that all of mine outperformed in terms of lowest predicted MFE:
| Rank when sorted by MFE | UTR Label | Optimal Predicted MFE (kcal/mol) |
| 1 | |three_prime_utr|ENST00000648994|GAN|81377597_81390809_+_16 | -4219.279785 |
| 2 | |three_prime_utr|ENST00000255784|CCDC134|41825824_41832164_+_22 | -2315.899902 |
| 3 | |three_prime_utr|ENST00000407071|KIF26B|245702607_245709432_+_1 | -2100.399902 |
| 4 | |three_prime_utr|ENST00000366518|KIF26B|245702607_245709431_+_1 | -2100.399902 |
| 5 | |three_prime_utr|ENST00000526861|SLFN13|35440594_35437543_-_17 | -896.900024 |
| 6 | BNT162b2/BioNTech | -84.699997 |
| 7 | LIVERNA | -36.500000 |
| 8 | mRNA1273/Moderna | -33.799999 |
| 9 | Stemirna | -10.100000 |
| 10 | RiboBio | -4.900000 |
This indicates that according to the MFE prediction model, the 3’ UTR candidates I propose offer significantly more stability and therefore temperature resistance than those currently used in commercially available mRNA vaccines.
Graph Visualizations of Candidate 3’ UTR Sequences
When visualized, these candidates produced massive and complex graphs showing hundreds of structural elements and pairings between them. The graphs of the two UTRs with the lowest MFE are shown in Figure 3.
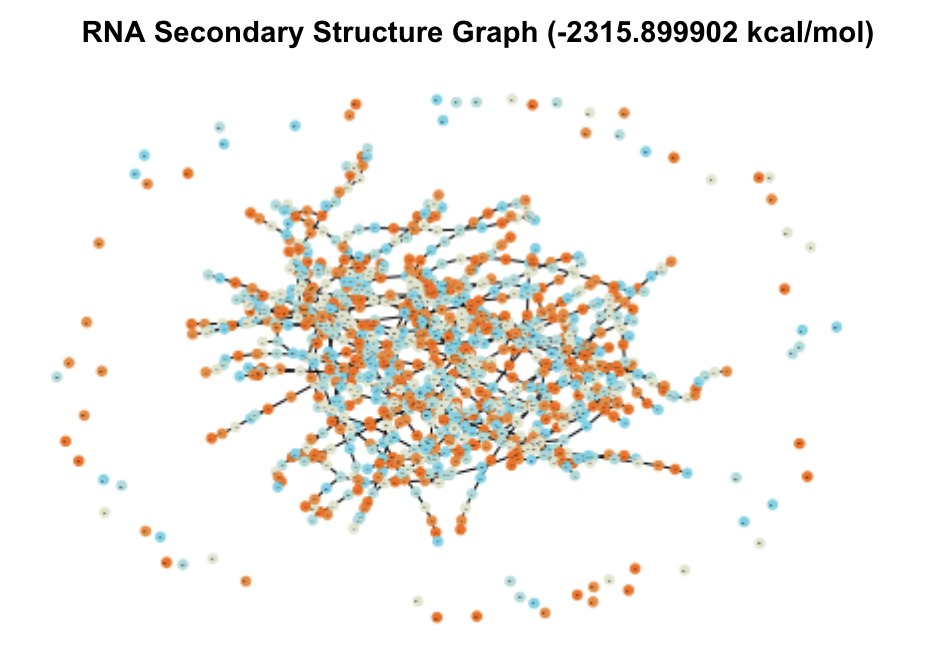
Figure 3. Secondary Structure Graphs of the 2 Most Stable Candidates
In comparison to test graphs made of UTRs with very small MFE values that contained 10-20 nodes, these graphs were significantly bigger in their number of nodes and edges. The top five UTRs had sequence lengths (measured in nt, number of nucleotides) of 13213 nt, 6341 nt, 6826 nt, 6825 nt, and 3052 nt. Comparatively, the UTRs from the database with MFE values of zero ranged from 0-20 nt. These two observations indicated to me that sequence and thereby structural complexity likely played a role in how stable (how low of MFE) a UTR’s optimal secondary structure was.
To test this hypothesis, a variety of features were extracted from the graphs of each UTR (a summary of them can be seen in Methods). These were then used as input for two forms of unsupervised learning: PCA, and then PCA -> tSNE.
PCA and Component Loading to Identify Important Features
PCA was run via sklearn’s package on the dataset with 3 principal components. After generating graphs for each combination of principal components, it was visually evident that the graph comparing the first and second principal components (as seen in Figure 4) was the most successful in clustering the dataset.
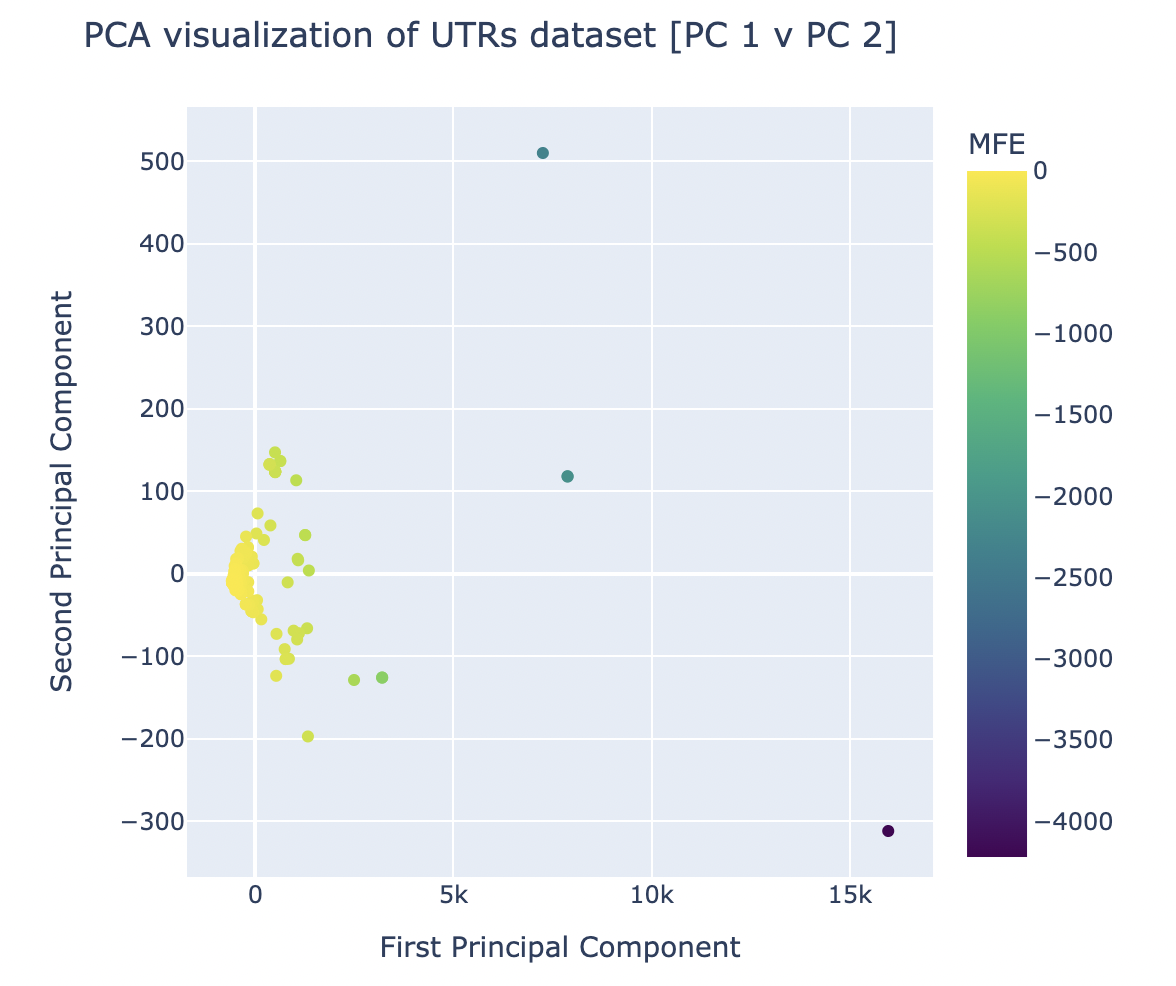
Figure 4. Results of Principal Component Analysis on UTR Features and MFE Values for Principal Components 1 and 2
The successful and clear clustering of the UTRs (the datapoints) based on their MFE values when graphed by PC 1 and 2 indicates the existence of features (that were used to generate the principal components) that made it simple to group the UTRs of different MFE brackets. In theory, this should mean that there are features that have a statistically-supported significant impact on the MFE of a UTR – this hypothesis was verified via component loading.
This technique (which can only be applied on pure PCA) was used on the graph shown in Figure 4 because it was the most successful combination of principal components in its clustering. The component loadings for this PCA can be seen in Figure 5.
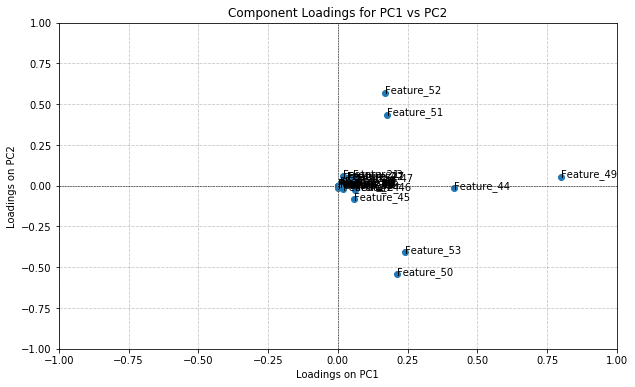
Figure 5. The graphed results of component loading for PCA using principal components 1 & 2
Based on their position in the upper right quadrant, the features with the highest positive contribution to both principal components are 49, 51, 52.
A feature’s position on the graph indicates how much contribution it had to the principal components. If a feature has a positive x-value, that means it positively contributed to PC1 and therefore a positive correlation exists between the two metrics. If a feature has a negative x-value, the feature negatively contributes to PC1 and a negative correlation exists. The same applies to the y-axis with contributions to PC2. Features located at the origin have minimal/zero impact on the principal components, which would mean that their values have little significance in the clusters produced when PCA in Figure 4.
As visible in Figure 5, features 49, 51, and 52 contribute positively to both principal components, and are the only values to do so. This would imply that the values of these features for a UTR hold importance over the labelled MFE value of the UTR. Feature 49 (the most impactful) corresponds to sequence length, feature 51 corresponds to the frequency within a sequence of a “G” nucleotide, and feature f2 corresponds to the frequency within a sequence of a “C” nucleotide. This supports the early-on hypothesis that sequence length is a key determinant of MFE, where longer sequences noticeably had lower MFE values. However, the importance of “C” and “G” nucleotides was not noticed or considered until these results.
PCA and tSNE for Dataset Visualization with Tightened Clusters
For the sake of improving the clustering visualization carried out by PCA (as seen in Figure 4) and viewing the dataset more clearly, tSNE was applied on top of the results of PCA. Several different combinations of # of principal components and # of tSNE components were iterated through to see which resulted in the lowest KL divergence value, a metric indicating the most successful clustering results. The optimal combination, with a KL divergence of 0.089, was found to be with 1 principal component and 2 tSNE components. This produced the clustering visualization shown in Figure 6.
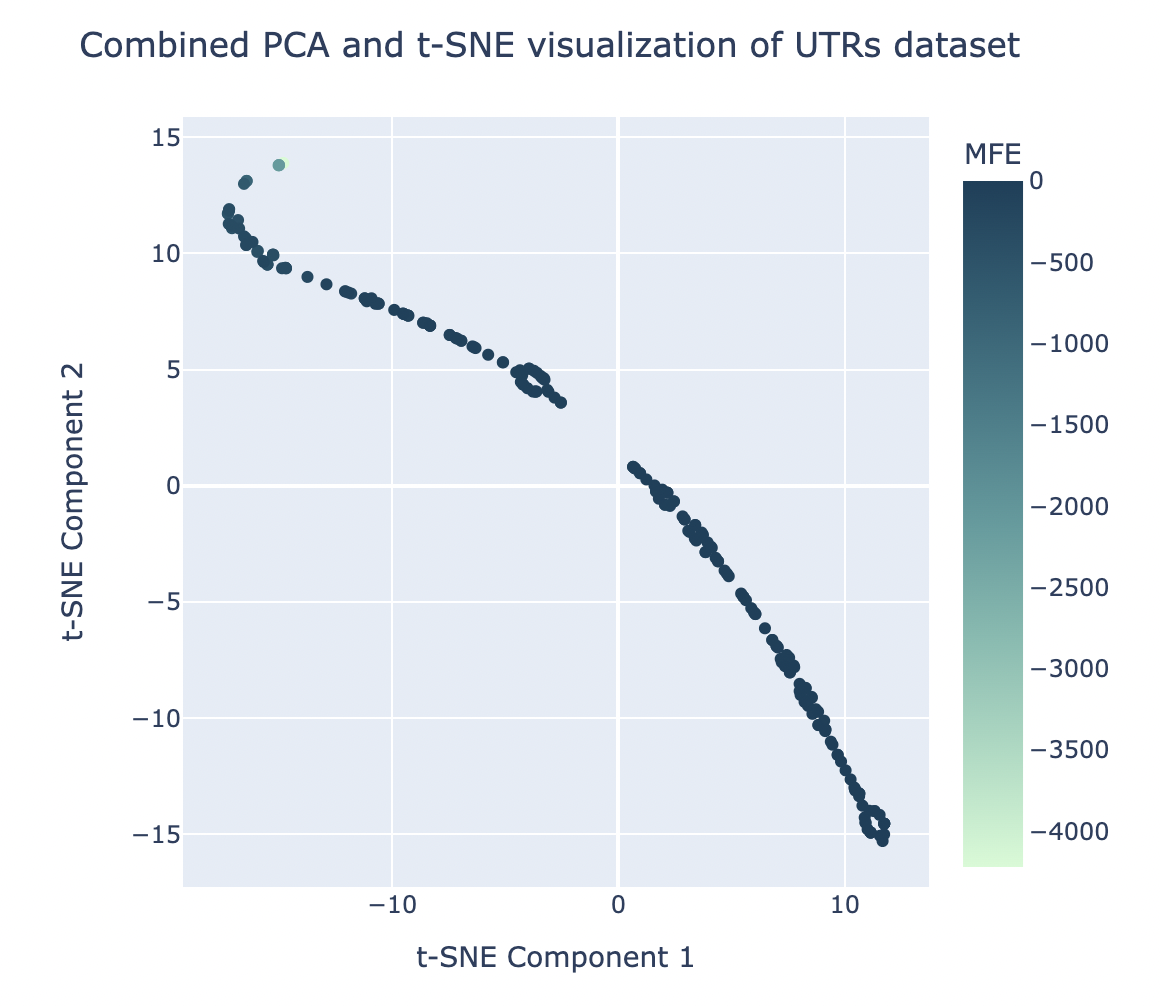
Figure 6. The graphical results of applying t-SNE (2 components) directly after PCA (1 component) for the sake of tightening clusters.
Conclusions
After identifying the gap in current vaccine research for optimizing the contribution of 3’ UTRs to mRNA stability, I parsed through a database of UTRs identified in nature and found several with optimal secondary structures that were more stable than UTRs used in industry. Unsupervised learning techniques were then leveraged to identify motifs or patterns in UTR sequences and structures that correlate with MFE. Sequence length, as well as “G” and “C” nucleotide frequencies, were found to be significant determinants of a UTR’s MFE value. This might indicate that in the identification or creation of stable UTRs, these variables should be optimized for to confer higher stability of both the UTR secondary structure and the overall mRNA’s secondary structure (by way of cumulative stability).
The results of this paper could be expanded on in several ways. Firstly, the algorithms should be rerun on a higher batch size - ideally, the entire database of UTRs (which I have plans to do soon). This will allow for global minimization across the entire UTR space – leading to the identification of the truly most stable 3’ UTRs available in nature, as measured via MFE. Additionally, the mechanisms by which 3’ UTRs impact mRNA stability beyond just cumulative stability of secondary structures should be assessed and optimized for. This includes their interactions with RNA-binding proteins, along with several others discussed in Background. Beyond just stability, 3’ UTRs have important implications for mRNA translation efficiency and protein expression - these factors should be jointly optimized for when finding the most suitable 3’ UTR to be used in vaccines.
Nevertheless, stability is a significant and underlooked area of optimization that this paper aims to spark more interest in. To improve the utility of the mRNA vaccine in fighting future pandemics, we need them to be accessible worldwide. This means designing them to be useful and usable by those in low and middle income countries without the same resources for cold-chain logistics, particularly as their populations comprise the majority of the globe. This paper optimizes one mechanism by which 3’ UTRs impact mRNA stability (cumulative stability _ MFE), but for the development of a highly thermostable vaccine as a tool for pandemic preparedness, more efforts should be concentrated towards optimizing 3’ UTRs for all of the ways in which they contribute to mRNA vaccine stability and function.
References
Awan, A. A. (2023). Introduction to T-SNE. https://www.datacamp.com/tutorial/introduction-t-sne Fahrni, M. L., Ismail, I. A., Refi, D. M., Almeman, A., Yaakob, N. C., Saman, K. M., Mansor, N. F., Noordin, N., & Babar, Z. (2022). Management of COVID-19 vaccines cold chain logistics: a scoping review. Journal of Pharmaceutical Policy and Practice, 15(1). https://doi.org/10.1186/s40545-022-00411-5 Fang, E., Liu, X., Li, M., Zhang, Z., Song, L., Bin, Z., Wu, X., Liu, J., Zhao, D., & Li, Y. (2022). Advances in COVID-19 mRNA vaccine development. Signal Transduction and Targeted Therapy, 7(1). https://doi.org/10.1038/s41392-022-00950-y Foged, C. (2022). Grand Challenges in Vaccine Delivery: Lessons Learned From the COVID-19 Vaccine Rollout. Frontiers in Drug Delivery, 2. https://doi.org/10.3389/fddev.2022.964298 Katella, K. (2023). Comparing the COVID-19 vaccines: How are they different? Yale Medicine. https://www.yalemedicine.org/news/covid-19-vaccine-comparison Kim, S. C., Sekhon, S. S., Shin, W., Ahn, G., Cho, B., Ahn, J., & Kim, Y. (2021). Modifications of mRNA vaccine structural elements for improving mRNA stability and translation efficiency. Molecular & Cellular Toxicology, 18(1), 1–8. https://doi.org/10.1007/s13273-021-00171-4 Lo Giudice, C., Zambelli, F., Chiara, M., Pavesi, G., Tangaro, M. A., Picardi, E., & Pesole, G. (2022). UTRdb 2.0: a comprehensive, expert curated catalog of eukaryotic mRNAs untranslated regions. Nucleic Acids Research, 51(D1), D337–D344. https://doi.org/10.1093/nar/gkac1016 RNA Secondary Structure as a Graph Using the forgi Library — forgi 2.0.0 documentation. (n.d.). https://viennarna.github.io/forgi/graph_tutorial.html Uddin, M. N., & Roni, M. A. (2021). Challenges of storage and stability of mRNA-Based COVID-19 vaccines. Vaccines, 9(9), 1033. https://doi.org/10.3390/vaccines9091033 ViennaRNA. (2023, July 20). PyPI. https://pypi.org/project/ViennaRNA/ Von Niessen, A. G. O., Poleganov, M. A., Rechner, C., Plaschke, A., Kranz, L. M., Fesser, S., Diken, M., Löwer, M., Vallazza, B., Beissert, T., Bukur, V., Kuhn, A. N., Türeci, Ö., & Sahin, U. (2019). Improving mRNA-Based therapeutic gene delivery by Expression-Augmenting 3′ UTRs identified by cellular library screening. Molecular Therapy, 27(4), 824–836. https://doi.org/10.1016/j.ymthe.2018.12.011 Yarlagadda, H., Patel, M. A., Gupta, V., Bansal, T., Upadhyay, S., Shaheen, N., & Jain, R. (2022). COVID-19 vaccine challenges in developing and developed countries. Cureus. https://doi.org/10.7759/cureus.23951 Zeng, C., Hou, X., Yan, J., Zhang, C., Li, W., Zhao, W., Du, S., & Dong, Y. (2020). Leveraging mRNAs sequences to express SARS-CoV-2 antigens in vivo. bioRxiv (Cold Spring Harbor Laboratory). https://doi.org/10.1101/2020.04.01.019877 Zhang, H., Zhang, L., Lin, A., Cheng, X., Li, Z., Liu, K., Liu, B., Ma, X., Zhao, F., Jiang, H., Chen, C., Shen, H., Li, H., Mathews, D. H., Zhang, Y., & Huang, L. (2023). Algorithm for optimized mRNA design improves stability and immunogenicity. Nature. https://doi.org/10.1038/s41586-023-06127-z Zuker, M. (1989). On finding all suboptimal foldings of an RNA molecule. Science, 244(4900), 48–52. https://doi.org/10.1126/science.2468181