Investigating Rotavirus Vaccination Rates with Differential Calculus
February 2021
Introduction
My background country, Nigeria, has the second-most number of deaths from rotavirus out of all countries worldwide (defeatDD, 2020). In 2016, an estimated 55,474 Nigerian children under 5-years-old died from this preventable disease (defeatDD, 2020). Rotavirus leads to a diarrheal disease, and diarrhea is the third largest cause of child mortality (Ritchie & Dadonaite, 2019).
Without an effective method for reducing rotavirus infections, needlessly high child mortality rates continue to plague Nigeria. In fact, I remember hearing stories of terminally ill children, often from diarrheal diseases, from my mother’s side of my family.
For some reason, the country has yet to reap the benefits of an effective solution; rotavirus vaccination. Still in the planning and introductory stage, this vaccine has yet to be incorporated into its national immunization strategy (defeatDD, 2020).
Other countries who have introduced and distributed these vaccines have made significant progress against rotavirus-related cases of diarrhea. Based on its efficacy rates as of August 2019, 53% of all deaths of children-under-5 could have been avoided with 100% rotavirus vaccine coverage. To tackle the growing problem of child mortality in Nigeria, intervening against this virus with a vaccination proven to be effective is essential (Ritchie & Dadonaite, 2019).
When researching this problem, I wondered: “If we have a known, effective solution to Nigerian child mortality, why isn’t it being used? Are other countries geographically proximal to Nigeria also facing difficulties with implementing this vaccine?”
Interestingly, I learned that other African countries have introduced effective strategies. For example, Sudan, Malawi, and Gambia have increased rotavirus vaccination rates from <10% to 85-90%+ over the past decades (Ritchie & Dadonaite, 2019). In my view, these countries that are making immense progress could provide direction with best practices to Nigeria with constructing a vaccination strategy.
Aim
I think the first stage of developing a bulletproof rotavirus vaccine strategy in Nigeria is understanding what successful ones look like. Therefore, I wondered if mathematical techniques and analysis could help me determine which country near Nigeria is progressing the most with rotavirus vaccine coverage. Hypothetically, I believe they could be a great role model for my home country.
After doing some research into how this could be done, I found comparable countries and calculus/functions techniques that could sate my curiosity.
I formed a more specific aim: how can instantaneous rates of change and function regression provide insight into which of Morocco, Ghana, Sudan, Rwanda or Ghana has made the most progress with Rotavirus vaccination coverage for children?
Rationale
As a Nigerian, if I wasn’t lucky enough to live in Canada as a child, it’s possible I could have also fallen victim to rotavirus and its fatal complications. This, and the fact that countless children are dying from a disease we can prevent made me heavily interested in this topic.
The African countries investigated as potential case studies for Nigeria were selected on the basis of several factors. These include their geographic proximity to Nigeria, their availability and accessibility of data, and their high rotavirus vaccine coverage rates.
To investigate my aim, the following methodology was used:
- Prepare rotavirus vaccine coverage data for regression by adjusting xaxis and creating a table of values
- Perform logarithmic, power, exponential, cubic, and quartic function regressions for each country’s vaccine coverage (%) over time (years) relationship
- Calculate standard error of regressions for each type of regression for each country, to measure goodness-of-fit
- Use the function with the lowest standard error of regression (meaning it fits the x-y relationship best) for each country
- Calculate instantaneous rates of change for each country’s function at , , or (depending on the year the country’s data begins and ends at, its domain)
- Graph each country’s instantaneous rates of change values (y) over time (x, years) and perform linear regression to model the relationship for each
- Record and interpret the country with a linear function of the largest, most positive slope to determine which country increased the most in vaccine coverage rates over time
Different concepts across functions, differential calculus, and statistics were combined in this process. Most were unfamiliar, like standard error of regressions and instantaneous rates of change, as they hadn’t been taught in my SL Mathematics course at the time of investigating.
Defending choices of mathematical techniques used in methodology
Logarithmic, power, exponential, cubic and quartic regressions were selected to be performed based on the following criteria: they were accessible on my TI-84 calculator, provided r2 values (necessary for calculating standard errors), and were nonlinear (so instantaneous rates of change could be determined). I wasn’t sure which function would best model my data, so out of curiosity and objectivity, I tried out all 5 of these regression options and determined which was most apt for my data based on which had the lowest calculated standard errors of regressions.
Instantaneous rates of change were used as the metric of a country’s progress with rotavirus vaccination because they quantify progress (change) with respect to time (x, years). Additionally, they provide more granularity and information about the function than average rates of change. To measure a country’s progress across their function’s entire domain, instantaneous rates of change were taken at multiple x values.
They were then graphed and modelled with linear regressions to find slopes, which informed me of which nation had the most growth in instantaneous rates of change. This was vital for my aim, because this country would have had the most increase in vaccination coverage over time, and therefore would be an effective case study for Nigeria. Linear regressions were used because their functions provide a single coefficient (slope), which is simple and optimal for comparison against each other. Nonlinear functions would have required unneeded complexity.
All final values were rounded up to a maximum of 3 significant figures for consistency and simplicity. However, values that were used for further calculations or regressions weren’t rounded at all. Instead, the value displayed by the technology that calculated it was directly used. This was for accuracy and precision - rounding would affect further calculations unnecessarily.
When rounding to 3 significant figures, even digits followed by 5 would be rounded down and odd digits followed by 5 would be rounded up. This technique was used throughout my exploration, for consistency and minimizing rounding error.
Time was used as the independent variable for my dataset to measure rotavirus vaccine coverage over time. This was judged as appropriate as this exploration is not stats-based, but instead focuses more on functions and calculus.
Background Information
Data
The public dataset used illustrates the relationship between time (years, independent variable) and the share of 1-year-olds who received the final recommended dose of the rotavirus vaccine in a country (%, dependent variable). A share of 1-year-olds vaccinated value of 100% would mean all 1-year-olds in a certain country received the final recommended dose of the rotavirus vaccine (UNICEF, 2019).
Function Regression
- Linear function →
- Logarithmic function →
- Cubic function →
- Quartic function →
- Exponential function →
- Power function →
These function regressions were performed with a TI-84 graphing calculator.
Out of curiosity, I tried to understand how function regressions were calculated. My learnings:
A logarithmic regression (LnReg) produces an equation of a logarithmic function that best fits the x and y data inputted. To do this, the natural logarithm (ln) is taken of the x-coordinates and then a linear regression is performed. Because ln(x ≤ 0) = undefined, all x values have to be positive (Roberts, 2016).
Linear and polynomial regressions (in my case, QuarticReg and CubicReg) are fit to data typically with the method of ordinary least squares (“Polynomial regression,” 2020). In which, data points’ variance from the regression line is iteratively minimized (“Least squares,” 2021). This least squares approach is also used for exponential and power regressions (“Nonlinear regression,” 2020).
Adjusted and Standard Error of Regression ()
I quickly learned in my research process that r2 wasn’t an optimal measure of goodness-of-fit for nonlinear regression models. Instead, the standard error of the regression (SER) was well-suited for linear and nonlinear regressions (Frost, 2019). Despite all my types of functions being nonlinear, my regressions were a mix of linear (polynomial) and nonlinear (exponential, power, logarithmic). Therefore, SER was a well-suited alternative to r2 for my investigation.
SER calculates the absolute measure of the typical distance that the sample data points fall from the line of regression, and is in the units of the data’s dependent variable (Frost, 2019). Lower SER values indicate a better fit of the regression to the sample data, because this means the distance between the data and the regression line is smaller (Frost, 2019).
In my mathematical exploration, SER was used to compare different function regressions against each other and determine which fit each country’s sample data the best. R2 values for each regression were provided by my TI-84 calculator, and they were solely used for calculated adjusted r2 values, which were then used to calculate SER values.
Formulas:
, from (Nau, 2020)
- Let represent the number of data points
, from (Nau, 2020)
- Let represent the value returned when the spreadsheet function (standard deviation of a sample) is applied to a list of values.
- Let represent the standard error of the regression
Instantaneous Rate of Change
Despite my total unfamiliarity with calculus, especially with derivatives, I sought understanding of how instantaneous rates of change were calculated to apply the concept in my exploration. They were vital for measuring rates of vaccination progress at specific points in my functions. They were then used to determine and compare increases in these rates of vaccination progress between countries.
Derivative ()
A tangent line is a line that touches a point on a curve, and is in some way parallel to the graph at that point. The derivative is the slope of that tangent line at any point on a graph. The derivative of a function f(x) can be expressed in prime notation as f′(x). This gives the derivative of f(x) at each point in its domain for which the derivative is defined (Strang & Herman, 2016).
Instantaneous Rate of Change
A derivative function can be used to find ‘instantaneous rate of change’ - the rate of change at a point, representing the slope of the tangent line. The instantaneous rate of change is the same as the derivative of a point on a graph (Strang & Herman, 2016). By substituting an x value into f′(x), the instantaneous rate of change can be calculated.
Important Derivative Rules
These were necessary in differentiating the (quartic, as determined later) functions, found through regression, used to model each country’s rotavirus vaccine coverage (%) against time (years) relationship.
- When , from (“Power rule review”)
- If for a constant , , from (Libretexts, 2021)
Calculations
Organizing Data
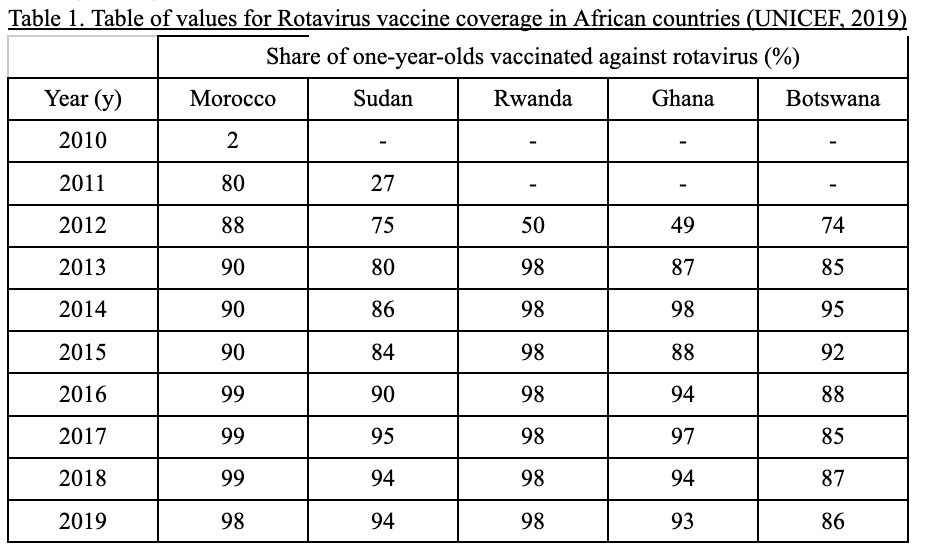
Table 1 displays the share of one-year-olds vaccinated against rotavirus (%) as a dependent variable for each of 5 countries; Morocco, Sudan, Rwanda, Ghana and Botswana. This is measured against the independent variable of time (year). A key assumption made here is that rotavirus vaccine coverage only began in the first year of reporting for each country (ex. 2012 for Ghana), as no data before those years was available. Some countries have no data points at certain years because of no vaccine coverage during those years.
This table of values (Table 1) was graphed:
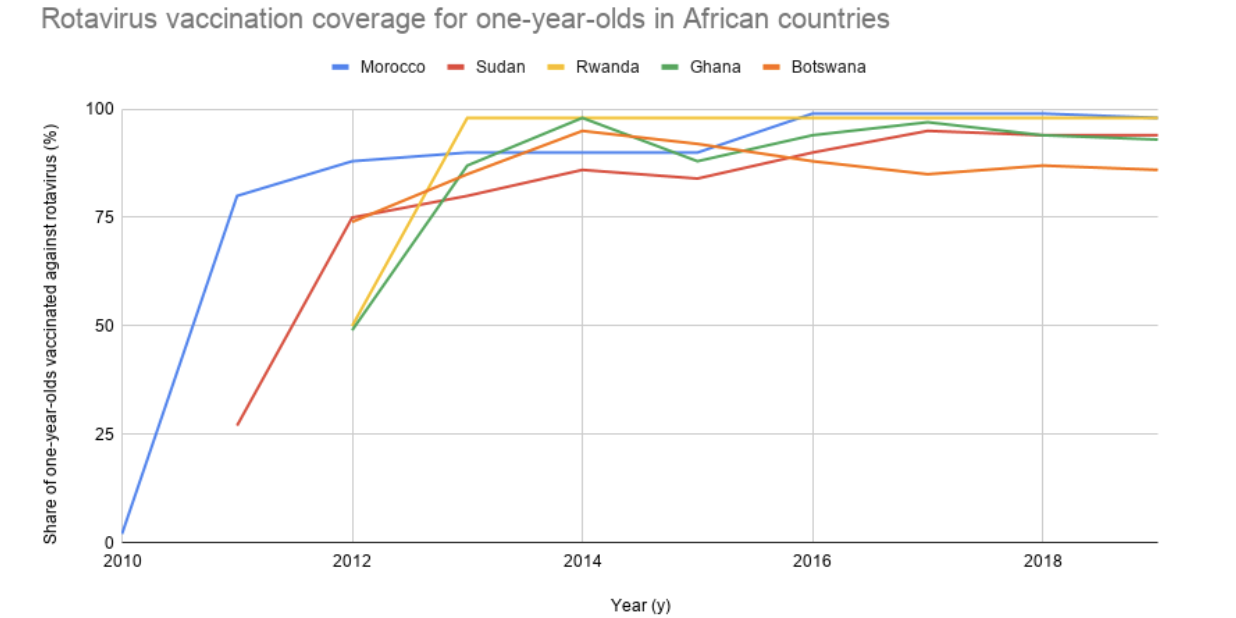
Figure 2. Progress over time with vaccinating one-year-olds against Rotavirus in Morocco, Sudan, Rwanda, Ghana and Botswana (UNICEF, 2019). Coverage seems to increase quickly and flatten out afterwards. Google Sheets was used for producing this graph.
Table 1’s x-axis was adjusted in Table 2 to measure years numerically instead of real values, for simplicity with future regressions and calculations. Increments between the years remained constant, so patterns in coverage remained the same (no key information was lost).
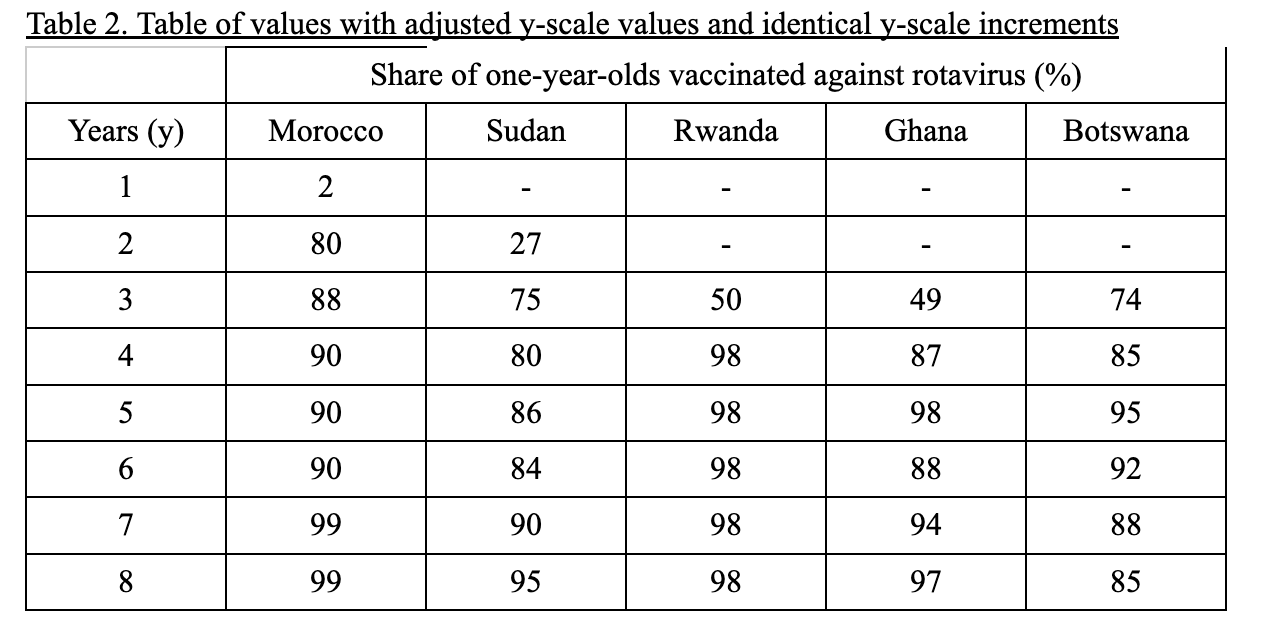
For simplicity with regression and future calculations, the x-axis was adjusted to show progress over years instead of vaccination rates at their actual, exact years. The shape of the new graph in Figure 3 is identical to that of Figure 2.
This new table of values (Table 2) was then graphed:
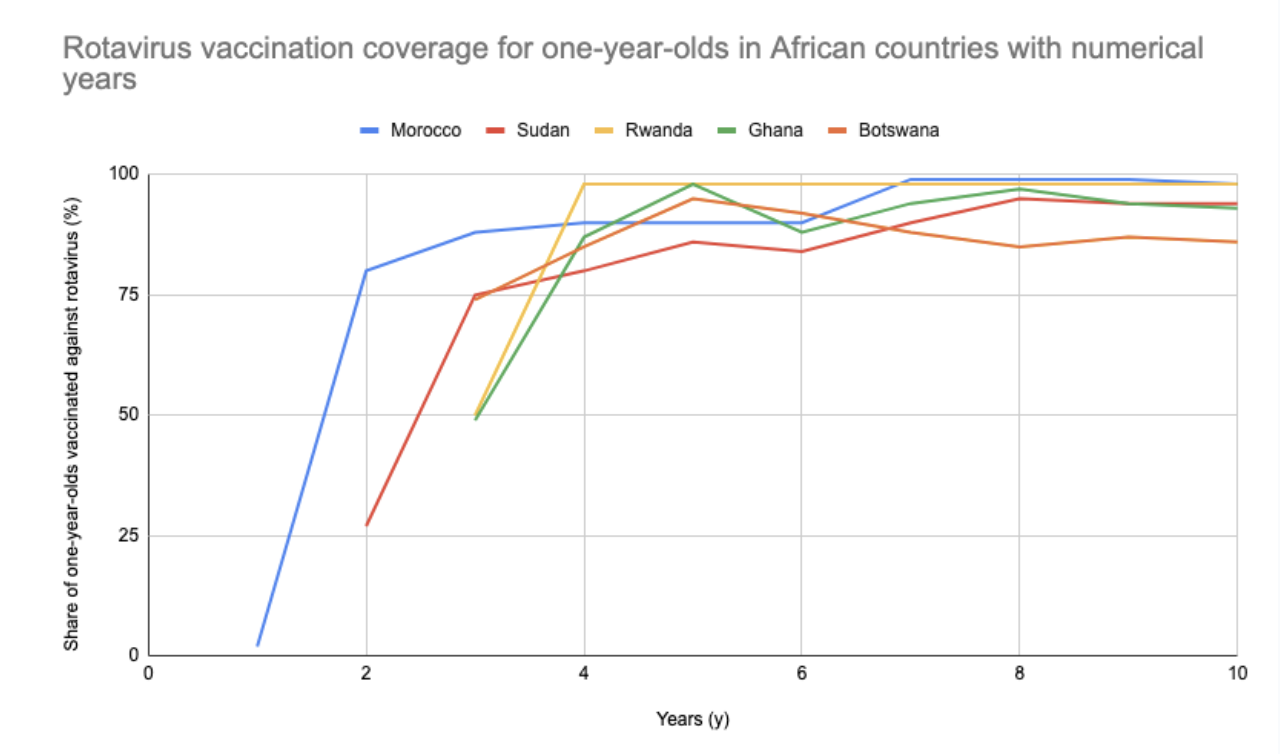
Figure 3. The x-axis was adjusted to show yearly progress with Rotavirus vaccination coverage. Google Sheets was used for producing this graph.
Function Regression
Each country’s x-y data points in Table 2 underwent 5 different types of function regression (logarithmic, power, exponential, cubic, and quartic), performed by my TI-84 calculator. Table 2 was stored in my calculator lists (L1-L6), and regressions were performed for each country. The Years column in Table 3 represents the years where data is available for each country (as shown in Table 2).
Table 3. Equations and r² values for different types of regressions for each country’s x-y data
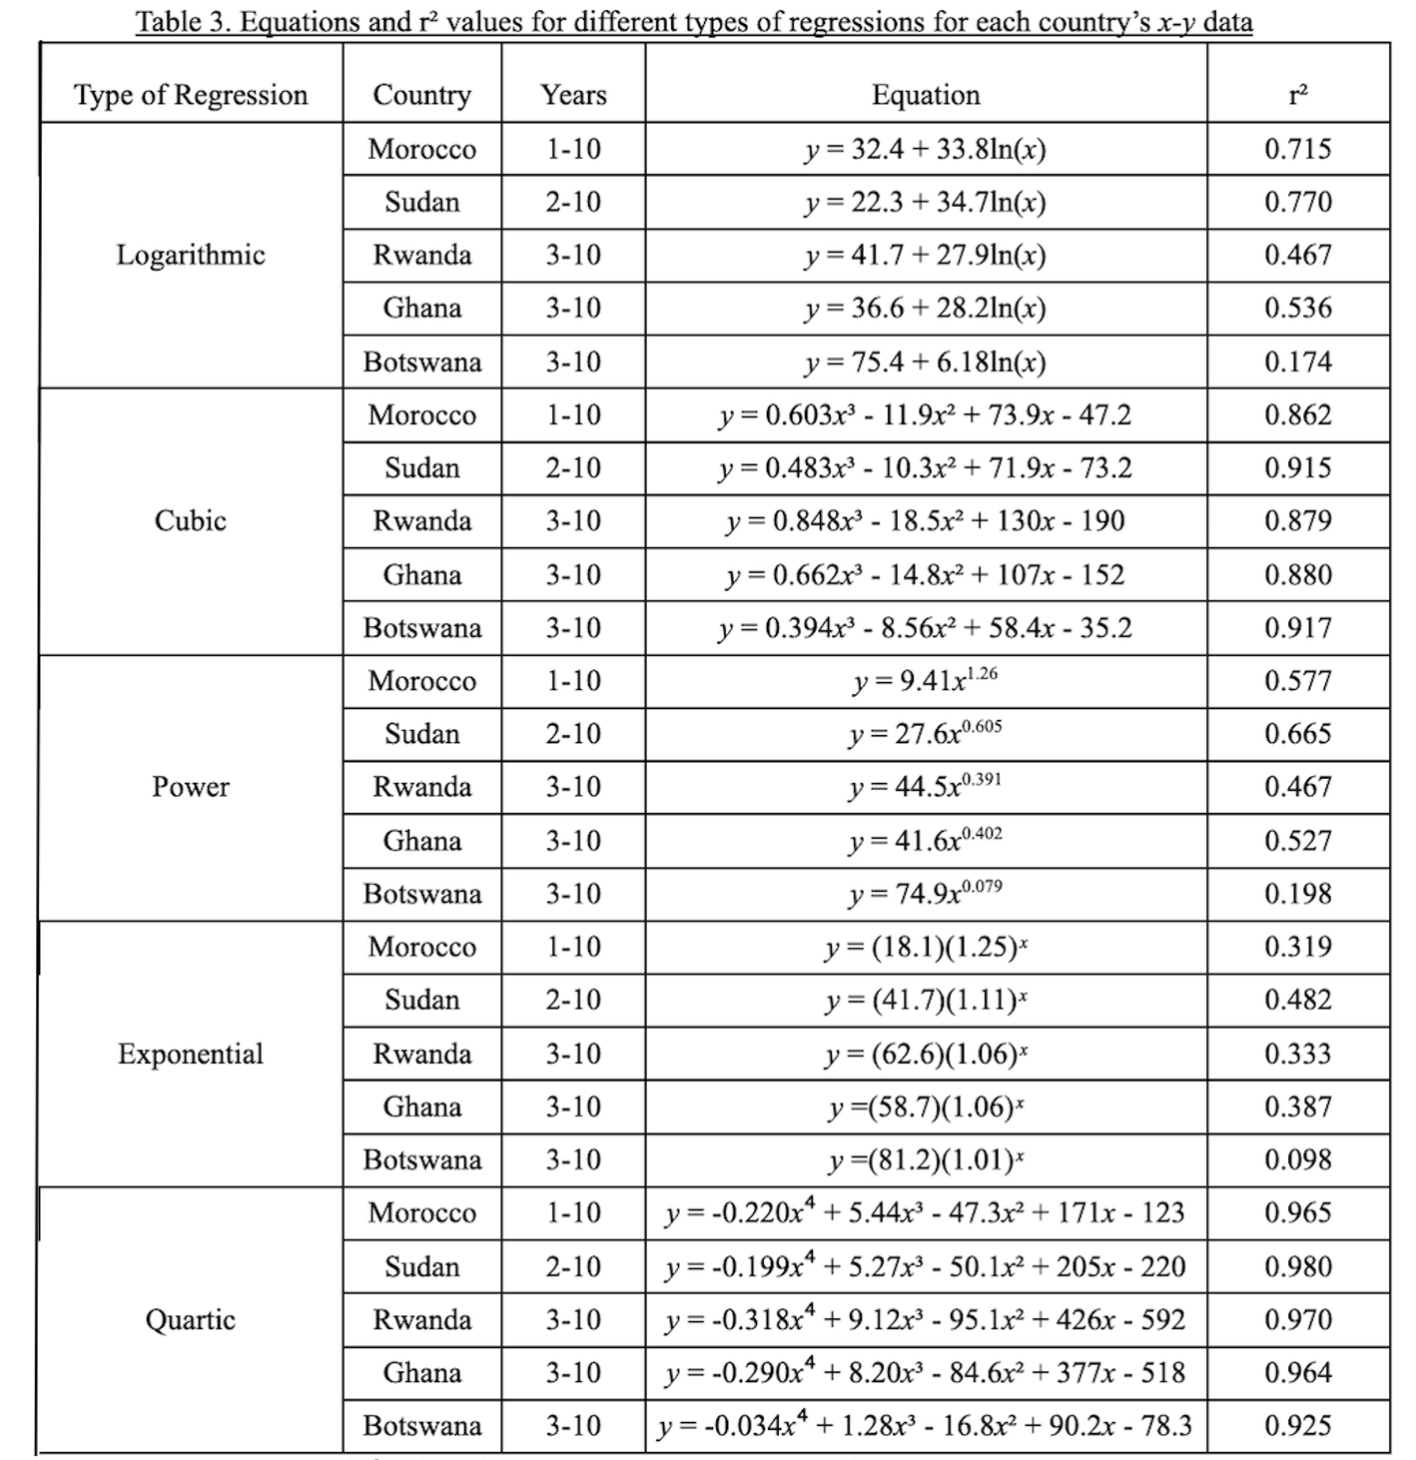
The functions and r2 values found for each country, for each type of regression. I noticed a pattern of higher r2 values for cubic and quartic (polynomial) functions.
Standard Error of Regression
Standard errors of regressions () were calculated for each regression performed:
- The value was converted to an adjusted value using
- The adjusted was used to find with
Google Sheets was used to automate these calculations, including performing the STDEV.S(Y) function. The regression model with the lowest standard error for each individual country was used, because it meant it fits the x-y relationship best (highlighted yellow). The strengths of this approach are clear; by doing multiple regressions and using an appropriate measure of goodness-of-fit (SER), the best type of function for my data can be objectively and accurately determined.
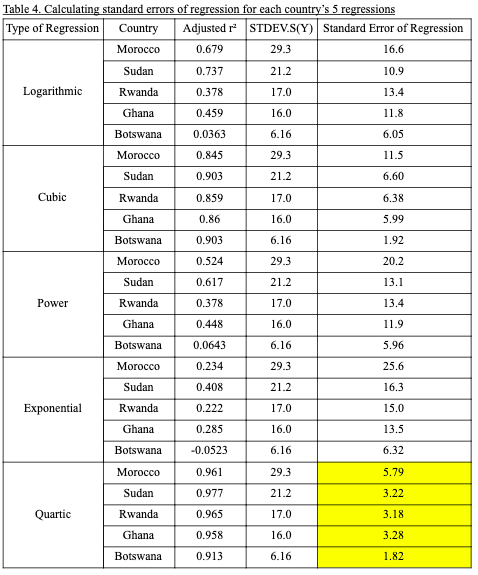
The quartic functions had the least standard error of regressions for all countries, meaning they were the best fit for each of their data. Thus, quartic regression was best suited for my data, and was used for further stages of my investigation.
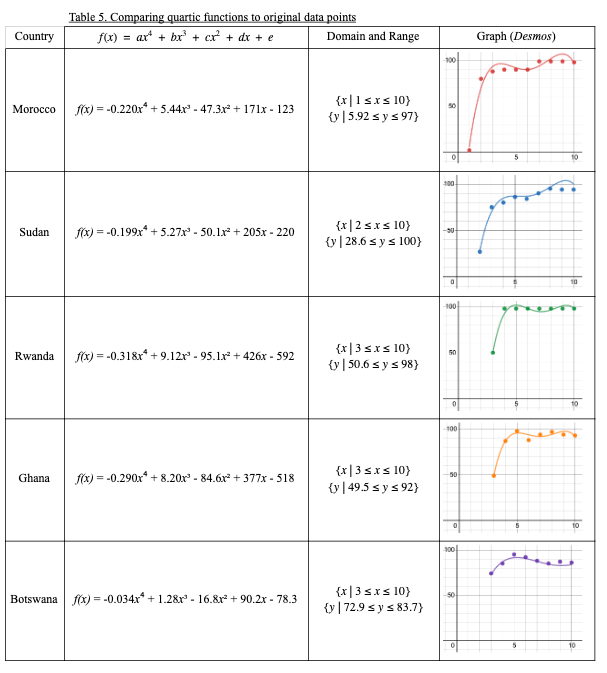
The quartic function found for each country’s x-y relationship was modelled against the original sample data within the country’s domain (years of data reported). Visually, the quartic functions seem to fit the data well.
Instantaneous Rates of Change
Now, with quartic functions of each country’s relationship, instantaneous rates of change were calculated and modelled. I did this by:
- Differentiating each country’s quartic functionto find f using the important derivative rules stated
- Calculating instantaneous rates of change at , , or , depending on which domain the country has (as shown in Table 5) by substituting values into
- Graphing each country’s instantaneous rates of change values () over time (), performing a linear regression for each country, and graphing the found linear function
- Determining which country had the least-negative slope (least decreasing)
Sample Calculation: of
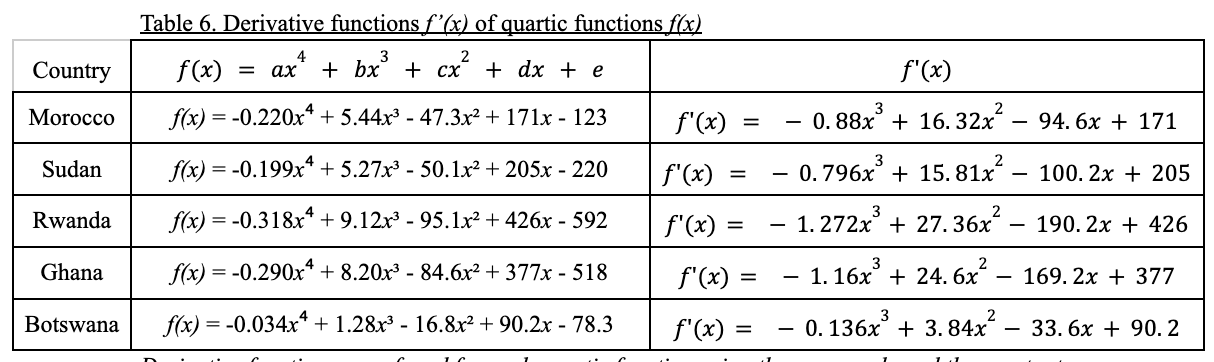
Derivative functions were found for each quartic function using the power rule and the constant rule. The degree of the derivative functions is 3.
Sample Calculation: Instantaneous rate of change at for Morocco’s
Morocco →
∴ Morocco’s instantaneous rate of change in rotavirus vaccination coverage at year 1 is 91.84 percentage points/year.
I used this process to calculate instantaneous rates of change for each country, for all its Years (x) values:
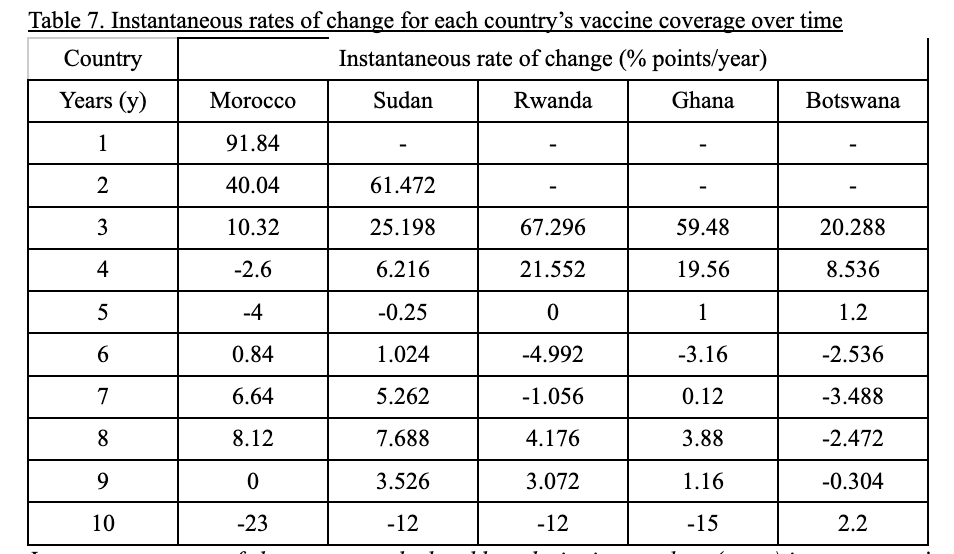
Instantaneous rates of change were calculated by substituting x-values (years) into a country’s respective derivative function and solving for f’(x). Instantaneous rates of change are sometimes negative and sometimes positive, graphically explained by the derivative functions’s many turning points.
Linear regressions were then performed with a TI-84 calculator’s LinReg function to model the relationship between instantaneous rates of change (y) and years (x) for each country. A noticeable weakness I saw with this approach stems from the low values. Linear functions weren’t the best fit for my data. However, they were used because their slope values were easy to compare against each other.
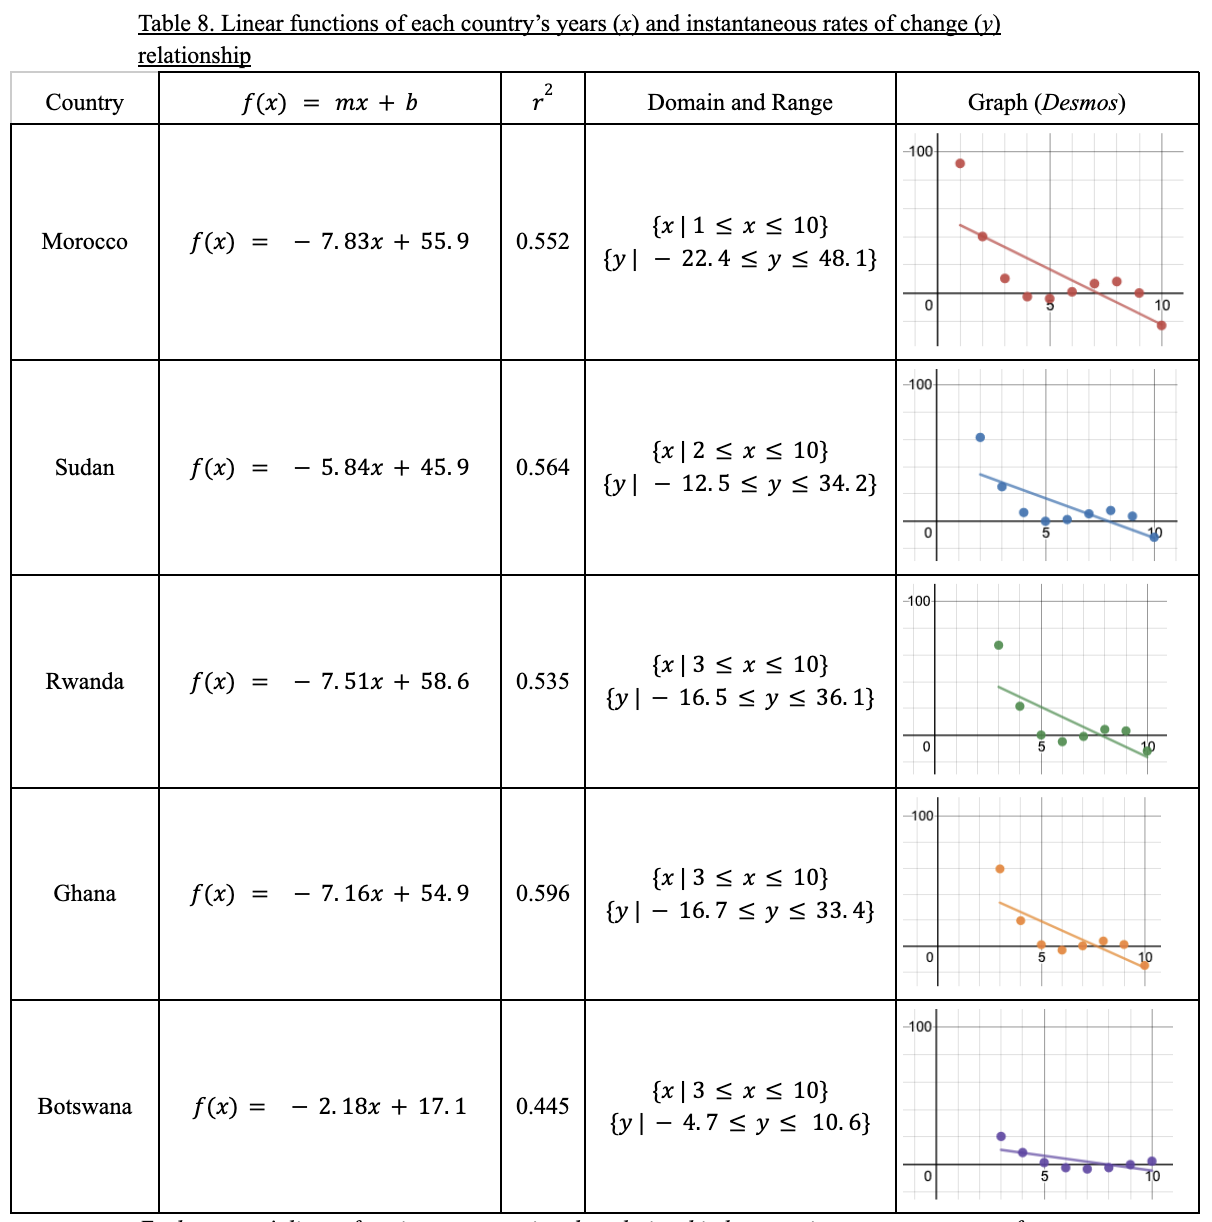
Each country’s linear function, representing the relationship between instantaneous rates of change of rotavirus vaccine coverage (y) against numerical years (x). Linear functions were compared against each country’s original sample data to assess, alongside r2 values, how well the regression fit my data.
Takeaway: Botswana has the smallest (least negative) slope with m = -2.18.
Implications of Findings
Conclusions
In conclusion, I found that Botswana had the least negative slope out of all 5 African countries investigated in Table 8. This means that their instantaneous rates of change for rotavirus vaccine coverage decreased the least over time (years). As their rates decreased the least, Botswana had the most increase in instantaneous rates of all the countries, and therefore increased the most in rates of vaccination over time.
Since the country increased the most in rotavirus vaccination rates, they’re clearly making more progress with their rotavirus vaccination strategy than the other countries. Thus, I argue that Botswana would be an effective case study for Nigeria in developing a system for national rotavirus vaccination.
Other Perspectives
Throughout this investigation, I thoroughly accounted for historical and global perspectives. Instantaneous rates of change were taken for the past 8-10 years (depends on each country’s domain), and used for analysis. Therefore, historical data was used to effectively find a solution to my aim. By using an abundance of temporal data, I had more evidence and the ability to calculate multiple instantaneous rates of change to prove that Botswana was increasing the most in rotavirus vaccination coverage.
Additionally, there was a strong presence of global perspective in my exploration. Specifically, because I researched and included several countries outside of Nigeria (my main focus) in my investigation. By utilizing the data of multiple countries, I had more room for analysis and more evidence to base my conclusion off of.
Reflection
Limitations & Improvements
- Limitation: my original dataset had a lack of data for African countries, especially those close to Nigeria. For example, in 2013, only 6 countries in Africa reported their share of one-year-olds vaccinated against rotavirus. Therefore, I had to resort to any African country with 7+ years of rotavirus vaccine coverage data, even if they weren’t proximal to Nigeria. This meant that a comparison of one of these countries to Nigeria (Botswana) as a case study wasn’t as strong as it could’ve been.
- Potential improvement: seeking out another dataset, with the same independent and dependent variables, that has data on more African countries. This dataset would also need to be equally reliable as the one I used.
- Limitation: for African countries that did have data, there were rarely enough years of reported rotavirus vaccine coverage. This is likely because of poor data reporting systems within Africa, caused by underfunded health information systems. This was another reason as to why I had to resort to African countries that weren’t as geographically close to Nigeria as intended.
- Potential improvement: seeking out another dataset, with the same independent and dependent variables, that has more temporal data points. This dataset would also need to be equally reliable as the one I used.
- Limitation: I could have done more regressions to have more options to choose from, but was limited by only a few options on my TI-84 calculator meeting my aforementioned criteria. However, I still was able to perform regressions of 5 different types.
- Potential improvement: finding a new tool to calculate regressions that meets my criteria, and offers a wider selection of types of regression.
- Limitation: using linear regression to model the relationship between years and instantaneous rate of changes for each country was a key weakness and limitation of my methodology. This is because the low r2 values implied the regression lines poorly fit my data.
- Potential improvement: using a type of regression that fit my instantaneous rates of change data better (as proven by SER). Then, determining how to compare functions of such regression type against each other, like how I compared slopes of generated linear functions against each other.
Extensions
More Mathematical Techniques & Connections To Other Fields of Study
I’m personally really curious about how this investigation could be extended to account for more variables to be solved like a multivariate optimization problem. For example, I could find a dataset that compared % share of one-year-olds vaccinated against rotavirus (dependent variable) against multiple independent variables like a country’s gross domestic product (GDP) or human development index (HDI). Then, I could model the data as a three-dimensional, multivariate function and solve for a global/local maximum to find the ideal GDP and HDI for maximizing vaccine coverage. This would also allow me to connect with more fields of study, like economics and public health systems - while producing more insights about important factors for improving vaccine distribution.
More Historical Perspective
Another extension to my investigation could increase historical perspective and provide me with more, highly valuable data points. I could look at countries that have had successful vaccination strategies in the past (ex. polio) and compare them with a similar methodology against each other in an attempt to find role models for Nigeria.
More Global Perspective
I could also extend this exploration further in the future by accounting for more countries that I could prove were comparable to Nigeria for reasons outside of geographic proximity (like similar economic status, population, etc.). This would also improve the amount of global perspective that goes into my mathematical investigation, because I’d consider even more countries and experiences worldwide.
Personal Learnings & Significance
This exploration was not only personally interesting from a curiosity perspective, but it challenged some misconceptions I previously had about calculus. As a student who hasn’t worked with calculus before, I’d heard rumours of its immense difficulty and thought it was too challenging to implement for this project. However, after self-teaching derivatives and instantaneous rates of change with only moderate difficulty, I have a more welcoming, confident outlook on calculus for the rest of my stay in high school.
Also, this inquiry was very personally significant in that it gave me direct experience applying high school maths in a real-life, interesting context. I initially thought classroom concepts like functions and statistics couldn’t meaningfully translate to any of my interests, but this exploration taught me otherwise.
I’ve learned how to apply challenging mathematical concepts to answer questions and solve problems in real-life contexts - something I didn’t think was possible prior.
References (APA)
DefeatDD. (2020, June 24). Rotavirus vaccination would save lives in Nigeria-but the poorest may lack access. Retrieved January 22, 2021, from https://www.defeatdd.org/blog/rotavirus-vaccination-would-save-lives-nigeria-poorest-may-lack-access
Frost, J. (2019, March 15). Standard Error of the Regression vs. R-squared. Statistics By Jim. https://statisticsbyjim.com/regression/standard-error-regression-vs-r-squared/
Least squares. (2021, January 14). In Wikipedia. https://en.wikipedia.org/wiki/Least_squares
Libretexts. (2021, January 2). 3.3: Differentiation Rules. Mathematics LibreTexts. https://math.libretexts.org/Bookshelves/Calculus/Book%3A_Calculus_(OpenStax)/03%3A_Derivatives/3.3%3A_Differentiation_Rules
Nau, R. (2020, August 18). Mathematics of simple regression. Statistical Forecasting: Notes on Regression and Time Series Analysis. https://people.duke.edu/%7Ernau/mathreg.htm#rsquared
Nonlinear regression. (2020, December 10). In Wikipedia. https://en.wikipedia.org/wiki/Nonlinear_regression
Polynomial regression. (2020, December 25). In Wikipedia. https://en.wikipedia.org/wiki/Polynomial_regression
Power rule review. Khan Academy. Accessed Feb, 15.2021. https://www.khanacademy.org/math/old-ap-calculus-ab/ab-derivative-rules/ab-diff-negative-fraction-powers/a/power-rule-review
Ritchie, H., & Dadonaite, B. (2019, August 22). Rotavirus vaccine – an effective tool that prevents children dying from diarrhea. Retrieved January 22, 2021, from https://ourworldindata.org/rotavirus-vaccine.
Roberts, D. (2016). Retrieved January 22, 2021, from https://mathbitsnotebook.com/Algebra2/Statistics/STregression2.html
Strang, G., & Herman, E. (2016). Calculus Volume 1. Houston, Texas: OpenStax.
UNICEF, W. (2019, August 22). Share of one-year-olds vaccinated against rotavirus. Retrieved January 19, 2021, from https://ourworldindata.org/grapher/share-of-one-year-olds-who-received-the-rotavirus-vaccine?tab=chart&stackMode=absolute&country=BWA~GHA~MAR~RWA~SDN®ion=World